ledgerely.com

View Categories

Datasource Pane

Datasource Pane-Ledgerely #

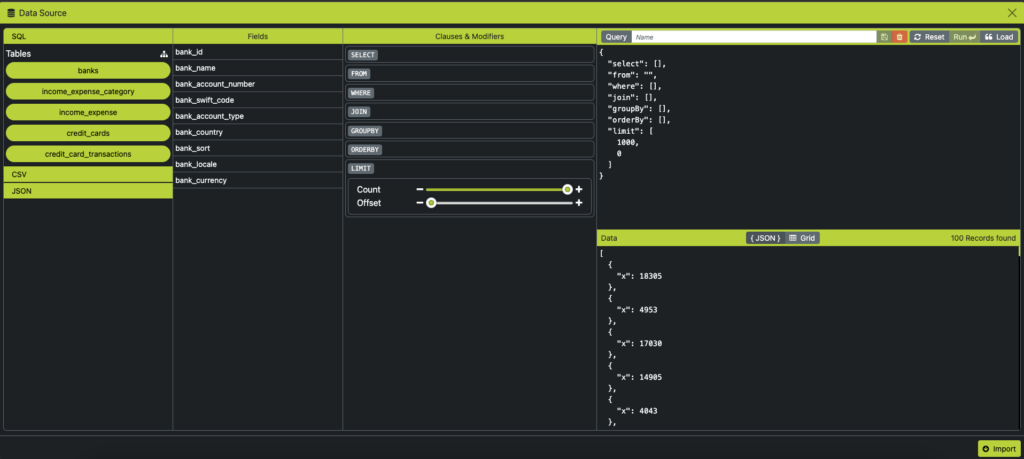
The Datasource Popup in Ledgerely enables users to import and manipulate data for chart visualizations. It opens when clicking on the green-bordered table within Chart Options → Datasource. This module is structured into five key sections:
  1. Options
  2. Fields
  3. Clauses & Modifiers
  4. SQL Preview
  5. Data Preview

Options #

Users can import data from three different sources, displayed as an accordion menu:

  • SQL Tables
  • CSV Upload
  • JSON Upload

SQL Tables #

  • Displays five main tables where all user transaction data is stored.
  • Tables are draggable and can be dropped into the JOIN or FROM section of the Clauses & Modifiers wrapper.
  • Once dropped, the query wrapper updates in JSON format.
  • The query can be executed at any time using the “Run” button.

CSV Upload #

  • Users can upload CSV files, which are then imported as a data source.

JSON Upload #

  • Users can upload JSON files, which are then imported as a data source.

Fields #

  • Clicking on a table name displays its available fields in a list format.
  • Each field is draggable and can be dropped into the SELECT, WHERE, GROUP BY, or ORDER BY sections within Clauses & Modifiers.
  • Once a field is dropped, the query wrapper updates in JSON format.
  • The query can be executed at any time using the “Run” button.

Clauses & Modifiers | Datasource Pane #

This section provides tools for SQL query customization and consists of the following features:

Editable Fields & Tables #

  • Any dropped table or field can be modified.
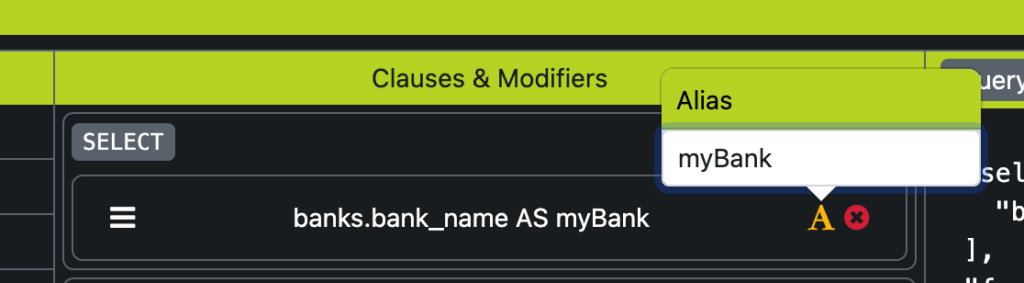
  • Aliases can be assigned to fields in the SELECT statement.

WHERE Clauses #

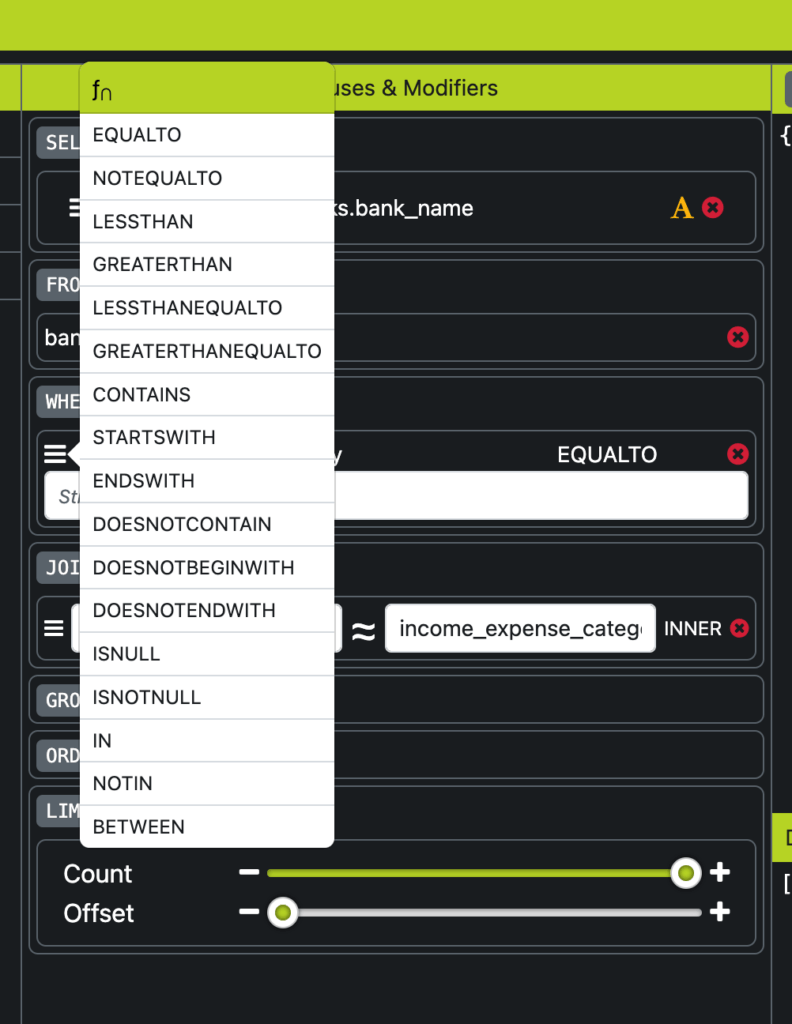
  • Comes with prebuilt options for common conditions.
  • Users can define filtering criteria easily.

JOIN Queries #

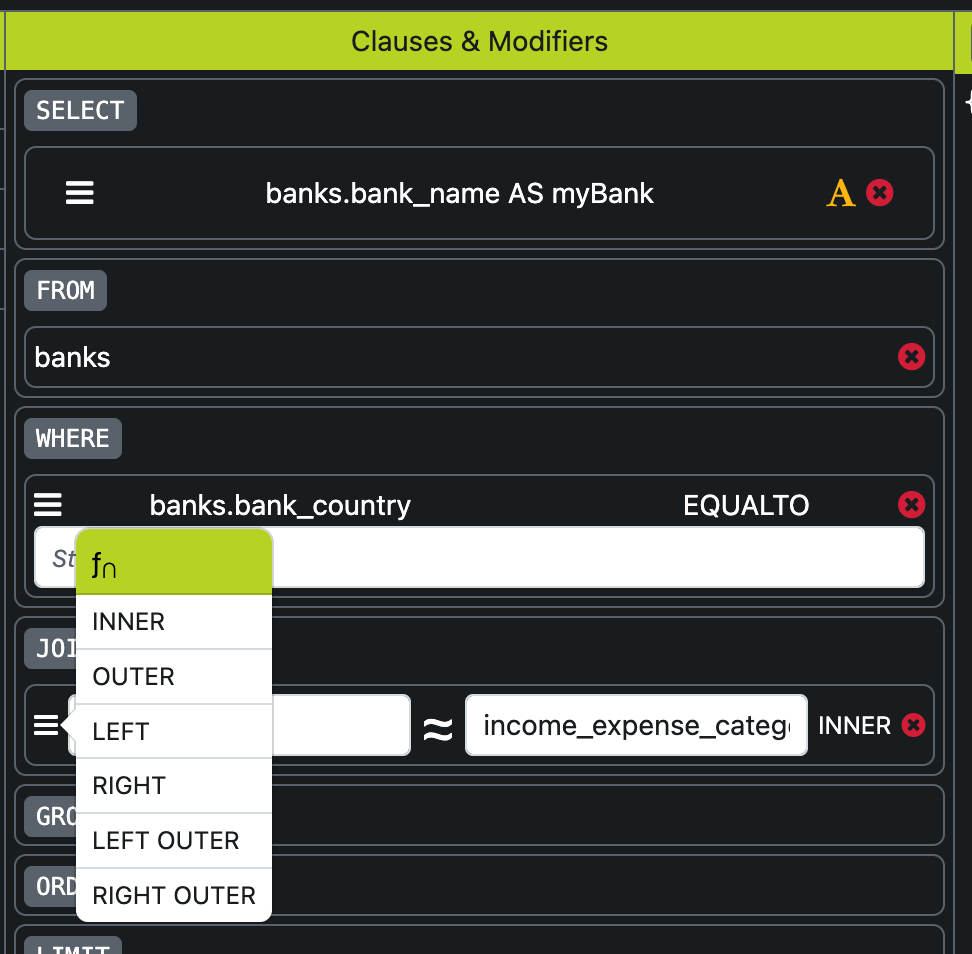
  • Prebuilt JOIN types are available for linking tables.

GROUP BY & ORDER BY #

Field-specific and fully editable.
Sliders for COUNT & OFFSET #

  • Users can adjust values dynamically using slider-based input handlers.

Query Execution #

  • The “Run” button executes the query and retrieves data in real-time.

SQL Preview #

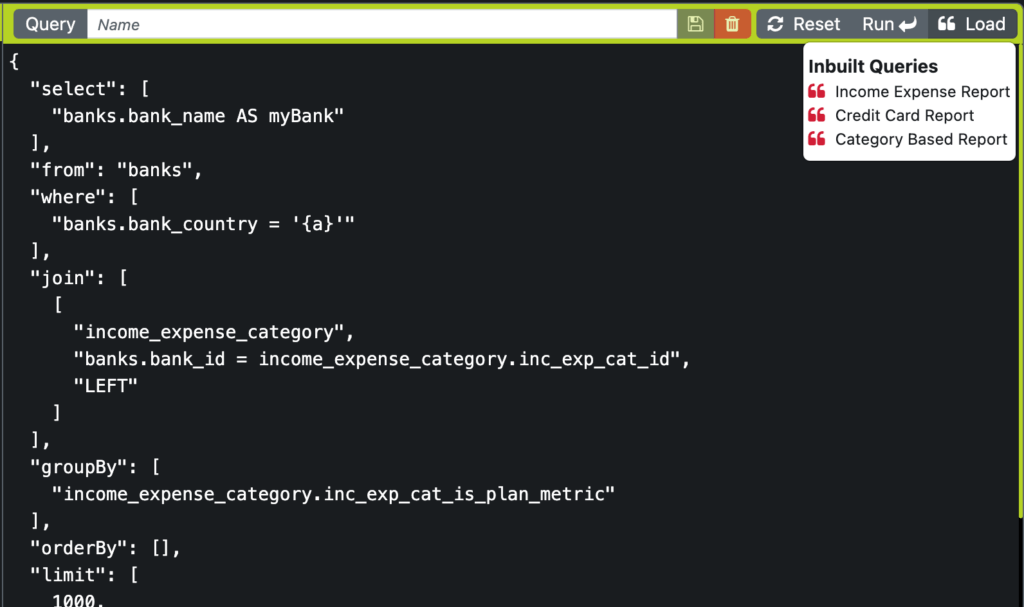
Displays the current query in JSON format and provides additional options:

Action Buttons #

  • Save: Users can enter a Datasource Name and save the query.
  • Reset: Resets the query builder to its initial state.
  • Run Query: Executes the query. If errors exist, an exception is displayed.
  • Load: Users can load prebuilt queries or previously saved queries for modification.

Data Preview #

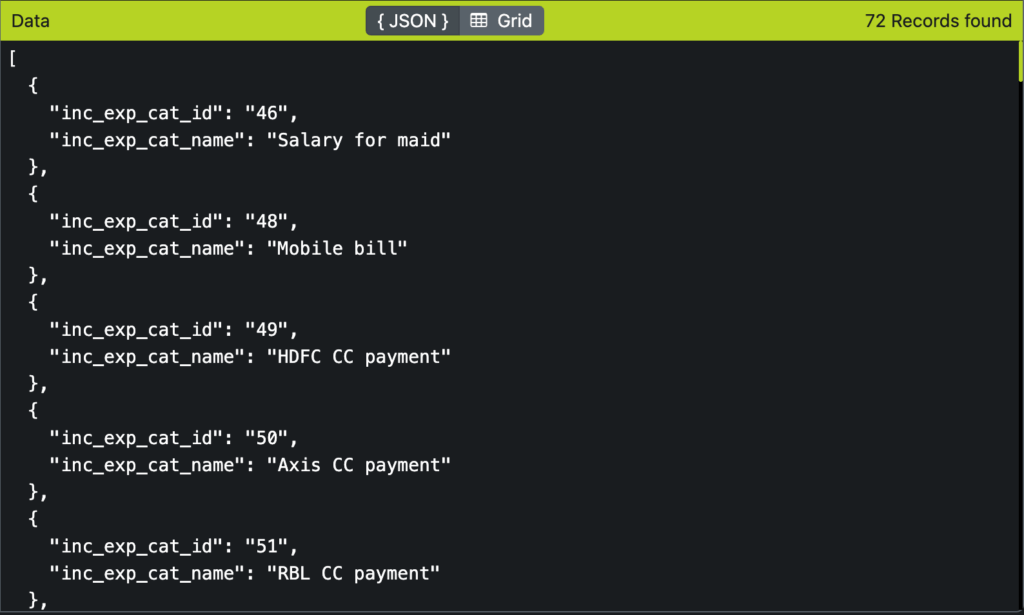
  • Displays query results in two formats:
    • Grid View
    • JSON View

Final Import #

  • Once the data is reviewed, clicking “Import” loads the data into the Datasource module.
  • The Datasource Popup closes, and the imported data becomes available for chart visualization.