Table of Contents
The financial dashboard in Ledgerely provides users with an interactive interface to analyze, manage, and track financial transactions efficiently. The interface includes dropdowns, buttons, visualizations, widgets, and data grids for a streamlined experience.
Dropdowns #
- Year Selection → Users can select a specific year to view financial data.
- Bank Selection → Users can choose a specific bank to filter transactions and visualizations.
Action Buttons #
| Button | Functionality |
|---|---|
| Fast Shopping | Quick access to frequently used financial transactions. |
| Bulk Import | Import multiple transactions at once to save time. |
| Schedulers | Set up scheduled transactions for automated payments. |
Visualizations #
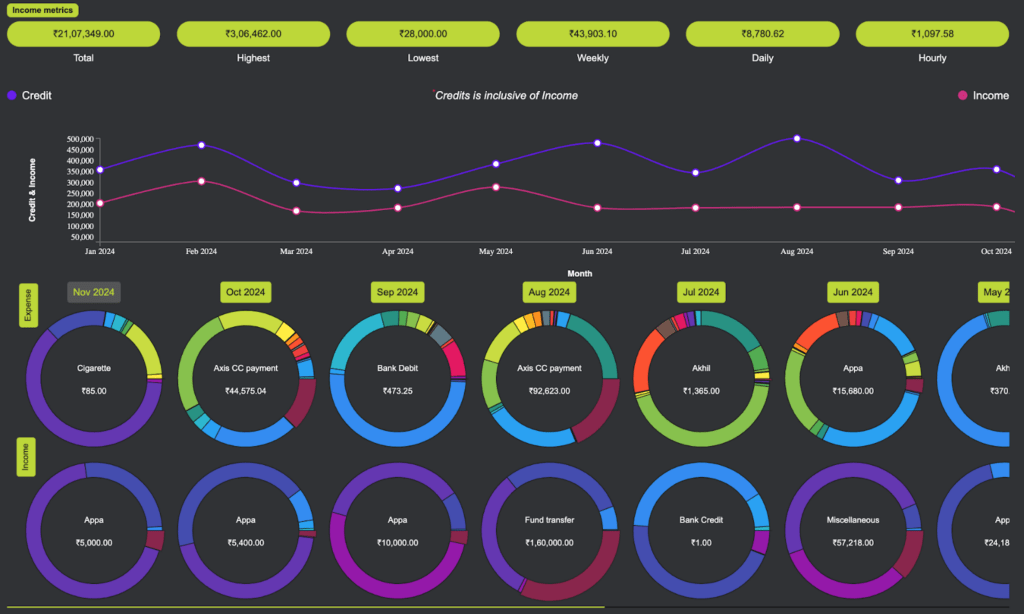
Yearly Overview (Dropdown Selection) #
- Provides insights into annual financial trends.
- Graphs show total expenses, income, and savings patterns.
Monthly Overview (Button or Line Chart Tooltip) #
- Displays detailed financial insights for a specific month.
- Tooltips provide quick stats when hovering over data points.
Plan Widget #
This widget categorizes financial plans based on their status:
- Good Plans → Successfully followed financial strategies.
- Bad Plans → Plans that deviated from set goals.
- Achieved Plans → Plans completed as per the set target.
- No Plans → Areas with no structured financial planning.
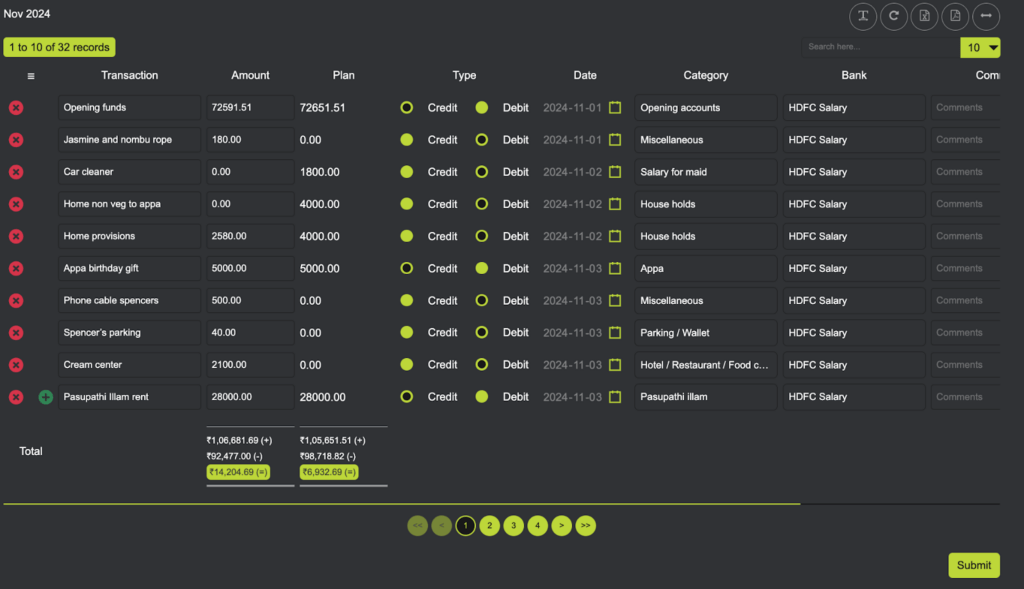
Displays all transactions for the selected month, including:
- Date
- Transaction Type
- Amount
- Status
Actionable Buttons for Transactions: #
- Tally Button → Matches records with bank statements.
- Replan Button → Adjust financial strategies based on past performance.
- Export to CSV → Download transaction data in CSV format.
- Export to PDF → Generate a report in PDF format.
- Fund Transfer → Directly transfer funds between linked accounts.
Note: This dashboard provides an efficient and organized way to manage finances, helping users make informed financial decisions with ease.